Key Data
Quantitative evidence can reveal patterns that are difficult to see otherwise — but measurements, definitions, and selections can introduce bias. We provide sources and methodological context so you can verify the data yourself.
Wealth concentration
In the United States, thetop 1% holds approximately 31.7% of all household wealth, while thebottom 50% holds just 2.5%(Federal Reserve Distributional Financial Accounts, 2025). This is not an anomaly — it is consistent with structural mechanisms through which returns to capital outpace wage growth and compound existing inequality. The trajectory has been accelerating, not stabilizing.
Wage vs. cost of living
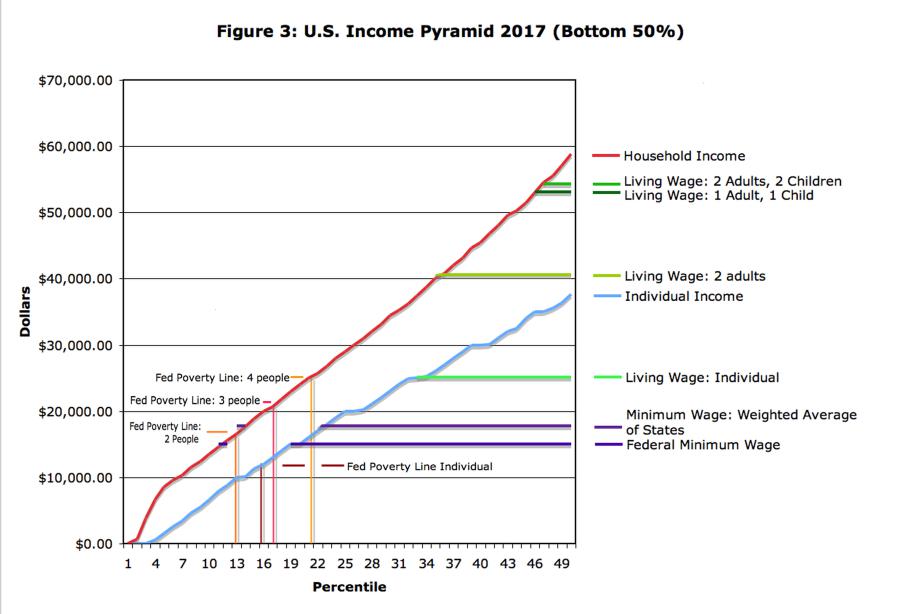
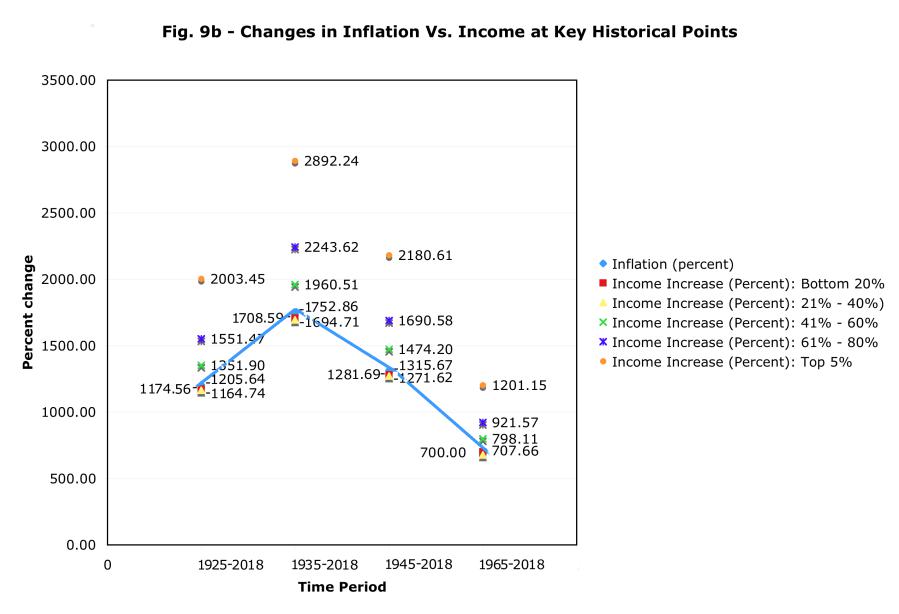
From 1978 to 2024,CEO compensation rose 1,094% while typical worker compensation rose just 26% (Economic Policy Institute, 2024). CEOs now earn 281 times what a typical worker earns — up from 21 times in 1965. Productivity has increased dramatically, but the gains have been captured almost entirely at the top.
Environmental trajectory
The extractive logic of growth-dependent economics drives accelerating resource depletion and pollution. Regulation can mitigate particular harms, but growth-dependent production continually recreates pressures for extraction and consumption unless underlying incentives and constraints also change.
Wellbeing metrics
GDP growth does not correlate reliably with improvements in human wellbeing past a certain threshold. Measures of life satisfaction, mental health, social cohesion, and sense of meaning show stagnation or decline in many wealthy nations — even as their economies have grown.
Post-transition projections
What happens to work hours, waste, and resource use when you remove the financial overhead? Concrete numbers based on current data.
For the complete evidence base:
Read Chapter 10: MetricsStored only in your browser. Nothing is sent anywhere.
Discussion
Share thoughts on Data and Evidence. Joining the conversation requires a pseudonymous username and password — no email address or real name needed.